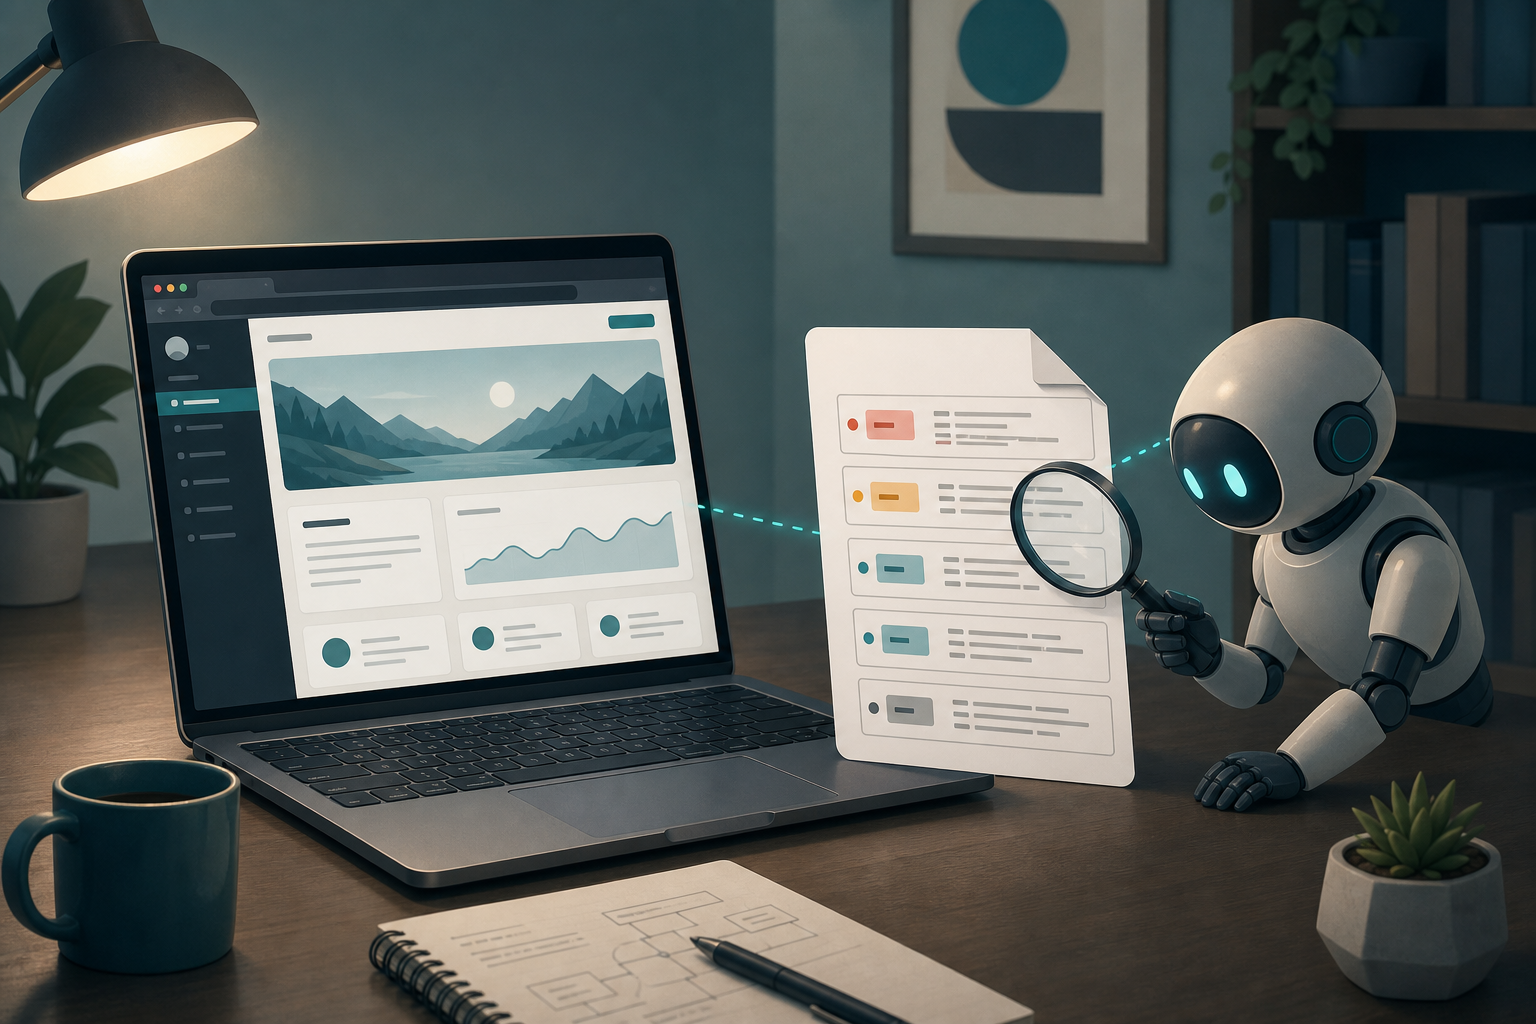
AI debugging logs solve a gap I hit often with Cursor: the agent can read my files, but it cannot see my app running. I ask it to fix something, run the app, hit a browser failure, then paste the console log into chat by hand. This is a deep dive into Layer 3 of my Cursor workflow: giving the agent a small, readable channel from runtime back to the project.
I call this pattern log for AI, or log-for-ai. The running app writes structured debug lines to a local file, and the Cursor agent reads that file before it suggests the next change. It is a simple way to replace guesses from source code with evidence from the path that actually ran.
The problem: the agent cannot see your app running
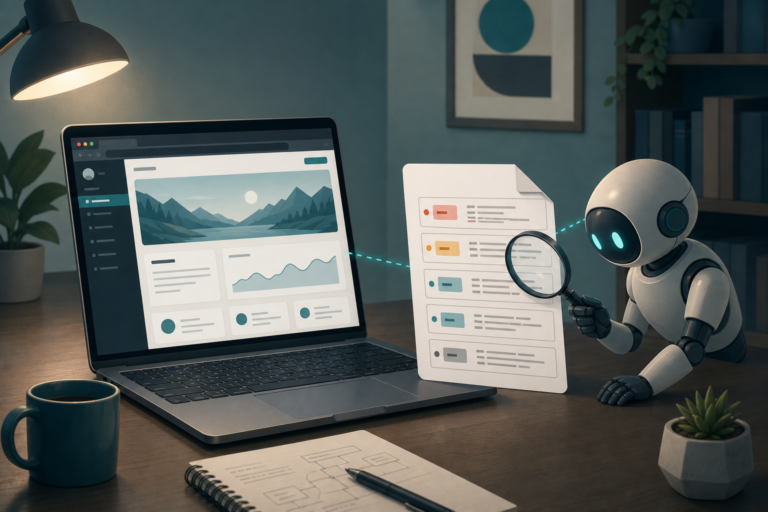
Source access does not give an agent runtime visibility. It can trace a function and explain the intended path, but browser console output, Electron renderer state, and live Node processes are outside its normal view. A fix can look correct in the diff while failing only after a click or an asynchronous request.
This blind spot matters most when the code and the running app disagree:
- Browser UI bugs may exist only in the browser.
- Renderer-only failures may never appear in the Electron main process.
- Async fetch paths can look fine in code while returning an unexpected response at runtime.
Without a shared channel, I become the bridge between the app and the agent. I copy a console line, paste it into chat, wait for a fix, reproduce the issue, then repeat. That loop is slow, and each pasted fragment can omit the input, the state before the call, or the result after it.
The problem is not that the agent cannot reason about code. The problem is that it is reasoning without the result of execution. I need a way for it to inspect the same runtime clues I would inspect myself.
The pattern: AI debugging logs the agent can read
AI debugging logs give the agent a local record of what happened while I reproduced a bug. The log file is the agent’s eye on the running app. I use _debug-log.txt as the default file name, then let the agent open it with its Read tool.
Each entry has a timestamp, a [TAG], and a JSON payload. A separator line makes nearby entries easy to scan when several actions happen in one reproduction.
2026-07-19T14:22:10.000Z [CLICK] {"target":"save"}
────
2026-07-19T14:22:10.180Z [FETCH_FAIL] {"message":"Request failed"}
────
The flow stays small:
- I ask the agent to add temporary log-for-AI instrumentation.
- The agent puts a short helper into the target file and adds calls around the relevant path.
- I reproduce the failure in the running app.
- The agent reads
_debug-log.txtand diagnoses the runtime path.
This is not a product or a plugin. It is a markdown skill paired with a folder and file convention. Like the session handoff pattern, it stays local to the repository and uses tools the agent already has.
Two environments: direct write vs local log server
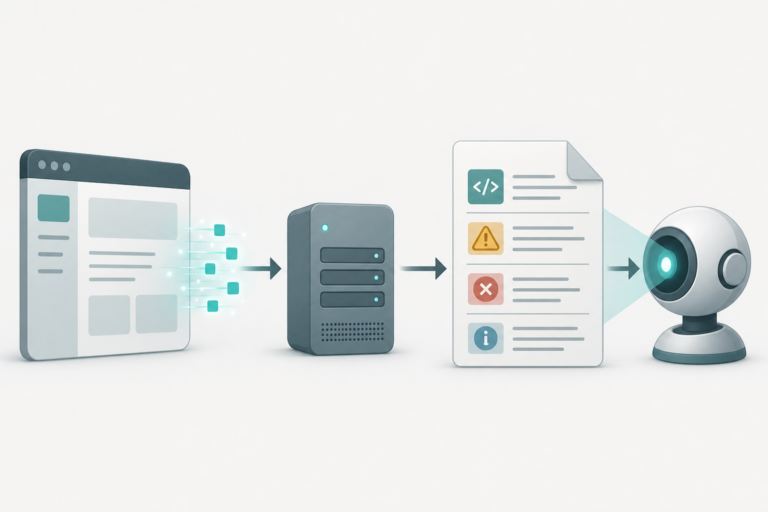
The environment decides how the log entry reaches the file. Node.js and the Electron main process can write directly because they have filesystem access. A browser page and an Electron renderer need a small local server because they cannot append to a file themselves.
Node.js and Electron main
For Node.js or Electron main code, I paste a small helper into the file I am investigating. It appends the structured entry directly with fs.appendFileSync, so no server is needed.
import fs from "node:fs";

function _dlog(tag: string, data: unknown) {
  const entry =
    `${new Date().toISOString()} [${tag}] ${JSON.stringify(data)}\n────\n`;
  fs.appendFileSync("_debug-log.txt", entry);
}
Python can use open(..., "a") for the same direct-write approach. The important part is not the language. It is that the entry lands in the one file the agent can inspect after the code runs.
Browser and Electron renderer
Browser and renderer code sends the entry with fetch to a tiny local HTTP log server. The server listens only on 127.0.0.1:9876, accepts a JSON POST, and appends to the same kind of log file. I keep the browser helper inline too, rather than adding a shared module for temporary instrumentation.
function _dlog(tag: string, data: unknown) {
  fetch("http://127.0.0.1:9876", {
    method: "POST",
    headers: { "Content-Type": "application/json" },
    body: JSON.stringify({ tag, data }),
  });
}
The local server is only a bridge from browser memory to _debug-log.txt. There is no package installation requirement for this pattern. I use it only while I need runtime evidence, then remove the server and all related code.
How the agent reads and diagnoses
The agent reads the log in execution order, then uses the tags to narrow the next investigation. I ask it to start with the latest reproduction instead of interpreting every old line in the file.
- Check the last tag to see how far execution reached.
- Search for
FETCH_FAILorERRORto find the failure point. - Validate values at each step against what the code expected.
- Use timestamp gaps to spot sections that took unexpectedly long.
Tags belong at branch points, not on every line. A REQUEST or CLICK entry records the input that began work. FETCH_START records a URL or parameters before an external call, while FETCH_DONE or FETCH_FAIL records its result.
I also use RESULT for an outcome summary, STATE for before-and-after values, and ERROR for a message and stack. These tags make the path readable without turning the log into a copy of every function call. The next fix is guided by what actually ran, not by a theory built from source alone.
AI debugging logs are useful here because they preserve the context around an error. A standalone error message tells the agent that something failed. The nearby tags can show which click started it, which request followed, and which value changed before the failure.
AI debugging logs also make the conversation with the agent more focused. I can ask about the missing transition between two tags instead of retelling the entire browser session from memory.
Cleanup is part of the skill
Temporary instrumentation must leave the repository when the debugging work ends. A helper that survives can add noise to future code reading, while a running local server or log file can confuse the next investigation. Cleanup is part of the skill contract, not optional etiquette.
Before I finish, I remove:
- the
_dlogdefinition and every call site - debug-only imports
_debug-server.mjswhen I used the browser or renderer bridge_debug-log.txt- the local log server process when it is running
I also recommend adding _debug-log.txt and _debug-server.mjs to .gitignore. That does not replace cleanup. It only prevents temporary artifacts from being added to version control while the debugging task is active.
The cleanup step keeps log for AI lightweight. The repository returns to its normal shape, and the next agent task does not mistake old runtime output for current evidence.
Wrap-up
Layer 2 of my workflow was session handoff, which helps an agent continue work across sessions. Layer 3 is runtime visibility: a file lets the agent inspect what happened after the code executed. Both patterns are small parts of the five-layer harness in my Cursor workflow.
The next deep dive will cover splitting editor and writer models in a content pipeline. For runtime bugs, I do not need a special vendor feature. A local file the agent can read is enough to turn a pasted-console loop into a debugging loop based on evidence.